
Read this guide in
PROTEIN BAR SENSORY GUIDE
Protein Bar Sweetener Testing: Taste Timing vs Storage Hardening
A practical guide for comparing equal-sweetness protein bar samples by taste timing, protein notes, bite, water activity and storage texture.
Equal sweetness is a useful starting point for protein bar testing, but it is not the finish line. Two samples can taste equally sweet at the first bite and then separate in bitterness, metallic notes, dryness, chew and storage hardness.
This guide is for B2B teams comparing monk fruit, stevia, allulose-supported and broader natural sweetener systems in real protein bar bases. The aim is to make the next sample more informative, not to select a universal formula from one water test.
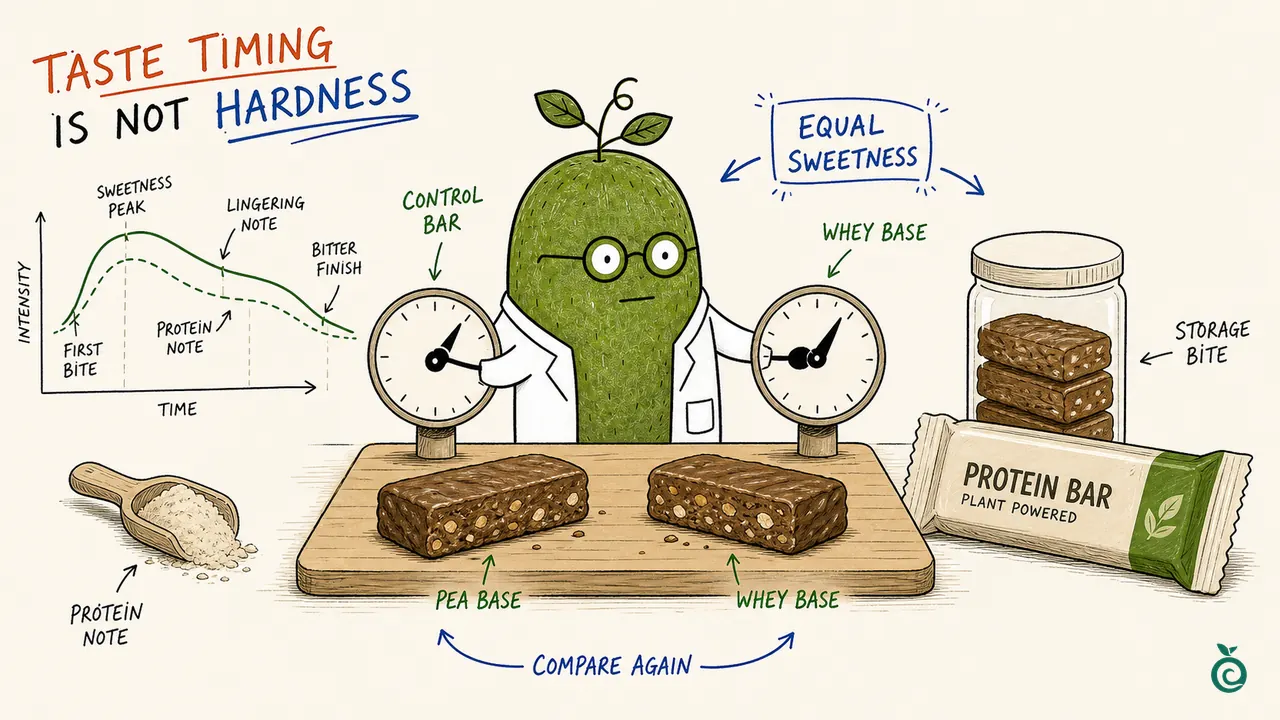
Read the tasting clock and the storage clock separately
A taste profile describes how sensations change while a bar is eaten; a storage record compares the bar at different ages. The drawn curves and clocks are schematic, with no measured seconds, hardness values or shelf-life result. Protein labels and the pictured plant-powered pack illustrate the discussion, not a confirmed formula, ingredient declaration or product claim.
Equal sweetness does not mean equal eating quality
Matching sweetness helps make a comparison useful, but it does not make the whole eating experience identical. Keefer et al. (2020) established iso-sweet levels in the actual protein-bar models before assessing flavor and storage texture. This is different from assuming that equal ingredient weight, equal peak intensity or one equally sweet first bite establishes iso-sweetness. The authors found taste and texture differences, but did not find that the non-nutritive sweeteners negatively affected hardness in that model. Our factory approach is to review taste and stored texture separately, rather than infer one from the other.
Protein source changes the result
Your actual base may contain whey, milk, pea, soy, rice, collagen or a mixture. The 2020 study itself compared pea protein, milk protein and whey protein isolate; it did not test every protein in that list. Its milk-protein bars needed less sweetener to reach the matched sweetness than its pea-protein or whey-isolate bars. Keep the protein material, grade, batch and complete bar formula with the result. A route that tastes clean in one base still needs comparison in the target bar; the study does not provide a universal dose for another protein or supplier grade.
Two time axes, two different records
Use the same coded sample system for both records. A second within a tasting session and a day of storage answer different questions; record them with separate units and methods.
| Record | Define the time basis | Keep beside the finding |
|---|---|---|
| Within one tasting | The starting event and any timed observations: first bite, chewing, swallowing and the finish | Portion, tasting temperature, chewing/handling procedure, descriptor definitions and any scale anchors |
| Between storage checkpoints | Time from the agreed production or packing baseline; record actual age and units | Formula and pack version, storage conditions, opening time and assessment temperature |
Choose the observation procedure before comparing samples. Do not invent a numerical persistence time from a note such as “long finish,” or treat one timed intensity as an overall liking score. If numerical ratings are used, retain the agreed scale, raw individual records and how any summary was calculated.
Test taste timing and hardness at the same nodes
At the chosen baseline and each storage checkpoint, compare sweetness onset, peak and finish alongside bitterness, metallic or licorice-like notes, protein aroma, first-bite hardness, chew, cohesiveness, dryness and stickiness. Keep water activity, moisture and color as separate measured fields when available. Retain sample code, portion, temperature, preparation and storage history. The 2020 research measured at days 1, 7, 14, 21, 28 and 35 under 35°C and 55% relative humidity; a project baseline at day 0 is a different convention. A screening schedule is not a validated commercial shelf life.
Keep sweetener and binder roles separate
Monk fruit and stevia may supply a sweetness lift at low use levels. Allulose, polyols, fibers, syrups and hydrocolloids can affect body, moisture, flow or binding, depending on the formula and market. Małecki et al. (2022) compared syrups and chocolate coating in a whey-protein-concentrate model; it was not a multi-protein comparison. Do not attribute a binder or water-balance problem to a sweetener name without a controlled comparison.
Make the next comparison answer one question
Keep the control and candidate comparable and identify every change. A tasting note points to a useful next comparison; it does not diagnose the physical or chemical cause on its own.
- Download the existing protein-bar paired checkpoint record (Excel)
- Review the full storage measurement methods
| Finding | Next comparison to define | Keep distinct |
|---|---|---|
| Sweetness level differs | Match the intended overall sweetness in the real bar before judging the finish | A dose difference from a change in taste quality |
| Bitterness or metallic finish differs | Compare coded samples with the protein/binder base and tasting procedure held constant | Bitterness, metallic notes and lingering sweetness as different descriptors |
| Dryness or chew changes during eating | Keep the portion and handling/tasting procedure fixed; record the actual base | Mouth-dryness from measured moisture content or aw |
| Hardness changes during storage | Compare the same test method, geometry, temperature, sample age and pack history | Instrumental compression, cutting and perceived first-bite hardness |
| A soft bar sticks or loses shape | Include wrapper release, shape and handling observations with hardness | Lower hardness from overall storage acceptability |
| Several formula or pack variables changed | Identify the changes and narrow the next trial where possible | A useful observation from proof that one ingredient caused it |
The storage scorecard already provides a free blank record with 32 paired control/candidate fields, including sweetness timing, texture, methods and pack history. Use one copy per checkpoint and keep the trial reference across the series. It has no automatic score or pass threshold, requires no email and is optional for contacting us.
Choose the next sample direction
If sweetness is right but the bar is hard, inspect protein source, binder, moisture migration, aw and packaging before simply increasing the sweetener. If the bar texture is fine but the finish is bitter or metallic, keep the matrix fixed and compare a narrower sweetness route. This one-change-at-a-time approach makes the next supplier conversation easier to interpret.
Technical references
Keefer et al. (2020) provides the iso-sweet comparison of pea, milk and whey-isolate bars, with temporal sensory observations and storage texture. Movaghar et al. (2026) followed moisture, aw, hardness, browning and protein structure during a 28-day gum-containing-bar model. Małecki et al. (2022) studied syrup and coating effects in WPC80 bars. Read each at that scope: none establishes a universal dose, finished-product approval or a shelf-life conversion for another bar.
Start with the taste or storage question
Tell us the bar type, final market and what you want the next sample to resolve. Add any known protein/binder direction, sweetness target, pack and existing observations. A finished formula, completed workbook or full storage dataset is not required to start. For the next round, agree the comparison goal, material/sample version, addition basis and conditions. Bring quantity, packaging scope and required documents into the final quotation discussion once the supplied product is identified.
Common questions
Does an equal-sweetness water test settle the protein-bar result?
No. Use it only for the question that was actually tested. Match the intended sweetness in the real bar and separately review its finish, protein notes, bite and storage record. Water does not reproduce the complete bar matrix.
Does the same peak intensity mean samples are iso-sweet?
Not by itself. State how overall sweetness was matched in the actual bar and which procedure was used. Equal ingredient mass, a shared peak or one equally sweet bite does not replace that calibration.
Did the cited 2020 study test soy, rice and collagen too?
No. Its bar models used pea protein, milk protein or whey protein isolate. A broader list of possible commercial protein bases should not be read as the materials tested in that study.
Can bitterness or a lingering finish identify the cause of hardening?
No. Record those taste attributes separately from storage texture. In the cited model, non-nutritive sweeteners did not negatively affect hardness despite taste differences. Define the next controlled comparison instead of inferring a cause from one descriptor.
Do taste seconds and storage days belong in one score?
Keep their methods and time bases separate. Within-session tasting describes the eating sequence; storage checkpoints compare bar ages. A combined score can hide a failed texture, pack or taste requirement, so agree the relevant criteria individually.
Can we use the existing Excel record without registering?
Yes. Download the paired checkpoint record directly, without an email address. It has blank control/candidate fields for methods, taste and storage findings, with no automatic score. The download and a completed record are not required to contact us.
What information helps start a sample discussion?
Begin with the bar type, market and taste or storage issue. Share the protein/binder direction, sweetness target, pack and observations you already have. We can clarify the next comparison before finalizing quantity, documents and quotation scope.
